Using TIM in five minutes.
Load simulation files
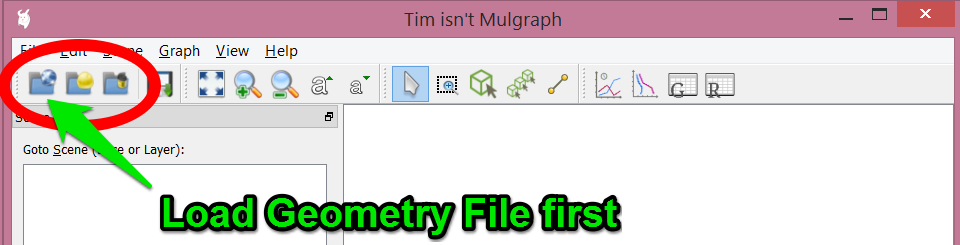
There are three types of files that you can (or should) load into TIM:
- Geometry file,
contains geometry of your simulation grid. You will need to load this before doing anything else in TIM. Upon loading, you will be able to browse your grid in layers or slices, with some related variables available, such as surface elevation.
- Input file,
having TOUGH2 input file loaded allows you to visualise the model's input parameters, such as rocktype assignment or permeability distribution.
- Output file,
TOUGH2's simulation result, often referred as listing file. This is the fun part. All variables from element, connection and generator tables can be visualised, such as pressure, temperature, or massflow between blocks.
View layers and slices
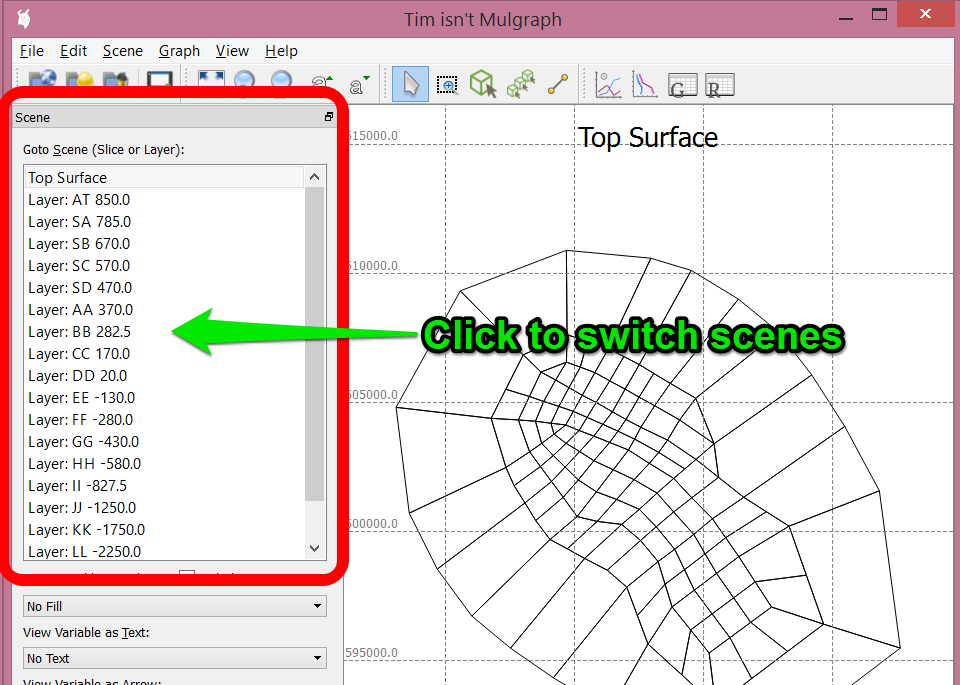
Scenes of all grid layers and a default slice will be created automatically as soon as you load a geometry file. You can quickly switch between scenes simply by clicking scene items in the Scene panel.
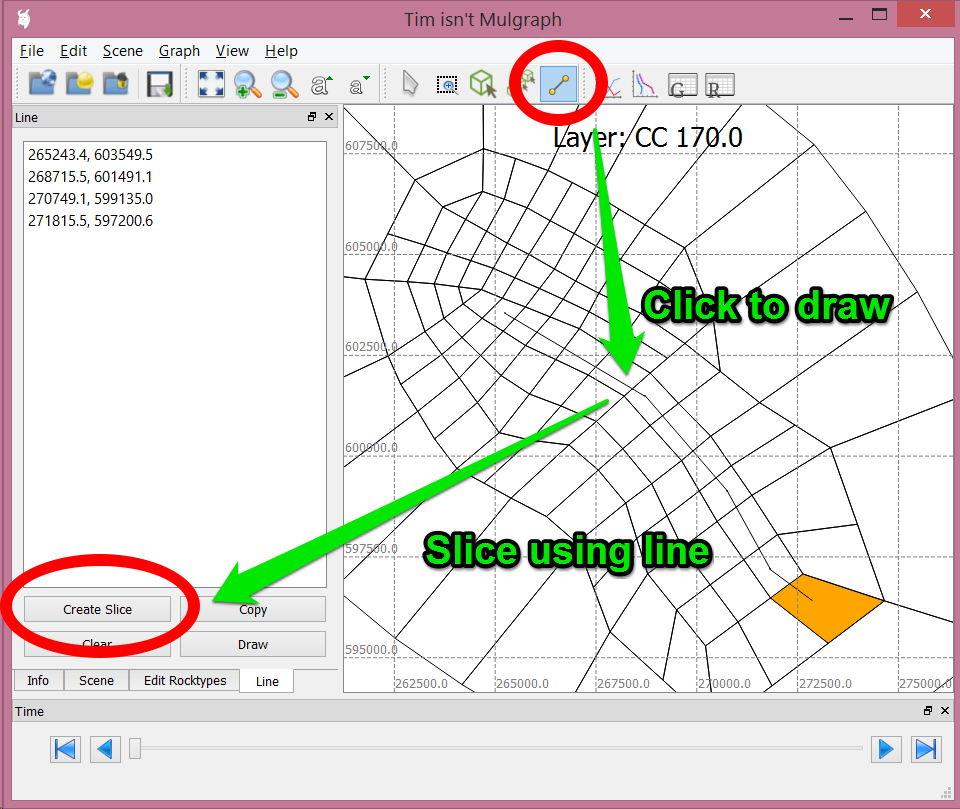
To create a new slice scene, use the Draw Line tool on any Layer scene. Left-click to add points, and right-/middle-click to end the line. The Line panel will show all points of the active line. Click Create Slice to create a slice scene from the line. You can have more than two points in the line (geologists love those).
Switch between panels
Each panel has its own set of tools, switch between them simply by click on the tabs. If you can't find what you saw, it's probably in another panel.

Display colors, texts and arrows
It's boring to just look at empty grids. In the Scene panel, there are three drop-down lists that you can control what to display in the scene.
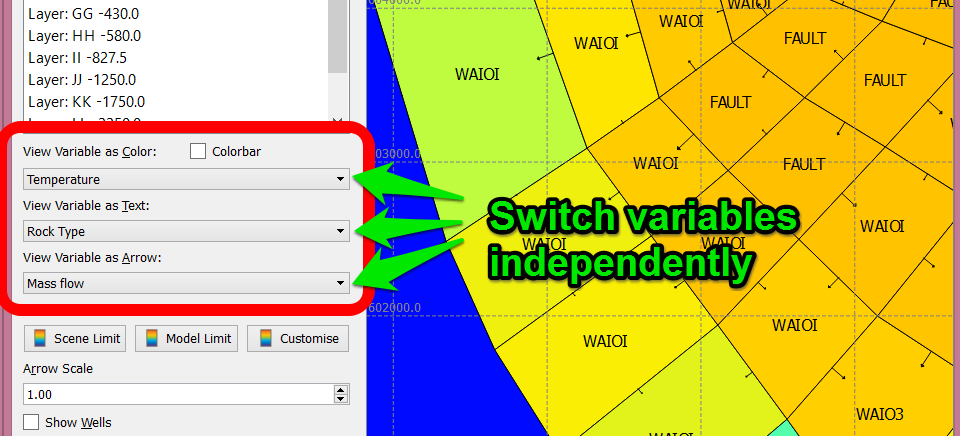
Colors can be used to represent scalar variables (such as temperature) that have one value per block. These variables can be displayed as Texts, which is particularly useful for things like rock types or block names. Arrows can also be added, and they represents connection quantities such as mass flow between blocks.
Note that variables selected for colors, texts, and arrows can be switched independently. Be creative, a scene with colorful temperature, clear rock type names, and flow arrows might save the day.
Downhole and history plots
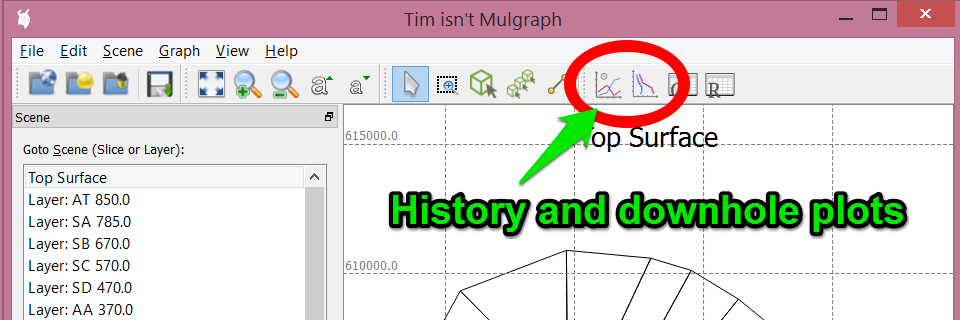
Line plots can be generated by bring out the History Plots and Downhole Plots windows. An empty Plot with a single empty Data Series will be available the first time you open one of these windows.
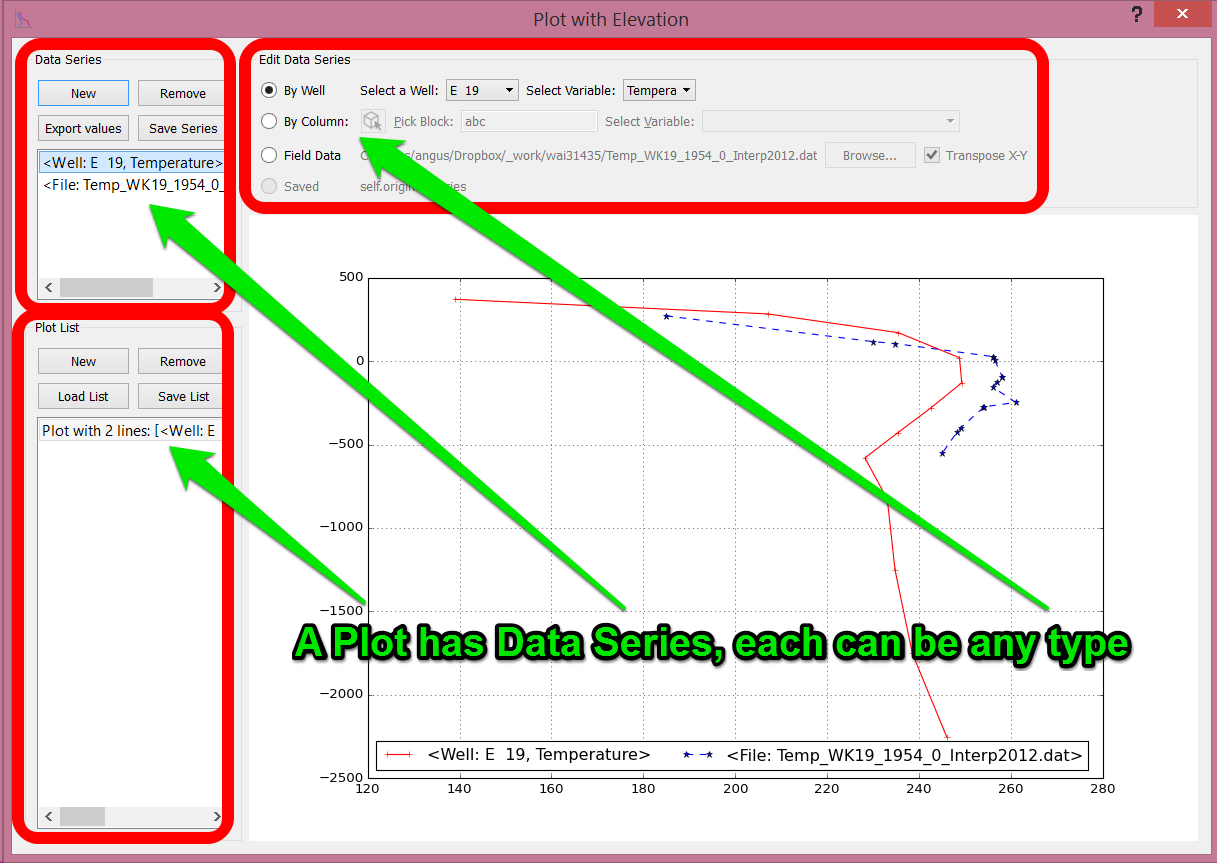
Select what to draw with the Edit Data Series panel directly above the graph. You can add more lines to your plot by adding data series. External field data can be loaded as Field Data series.
You can also add more plots and switch between them easily. The list of plots can be exported or imported. The list can be useful for batch plotting.